
How to use Search Seasonality.
Search Seasonality shows when demand for a search rises and falls across the year, from about eight years of monthly Google search volume. Look up one keyword, or give it a set and see the order in which they peak, so you can publish before demand starts to rise.
What this tool reveals
- When demand peaks. The month a search is usually busiest, and how much busier than an average month it gets.
- When the increase starts. The month demand begins its climb towards the peak. Content published before then has time to be found when people start looking.
- How reliable the season is. How many of the past years peaked in the same month, and whether there is a second, smaller season.
- Whether demand is growing. This year's total against last year's.
- The order of a whole set. A demand calendar of your keywords, sorted by peak month, with what is peaking, what is increasing now and what starts increasing soon.
Setup
-
Scan a keyword
Open tools.datahit.co/search-seasonality, type a keyword, choose a country and press Scan. No account is needed. The sample chips show a few keywords with very different seasons if you want to look around first.
-
Read the four figures
Above the charts: the peak month, when the increase starts (and how long until then), the typical volume in the peak month, and the trend. When a keyword has no strong season, the figures say so instead.
-
Scan a keyword set
Switch to Keyword set. Paste one keyword per line (a spreadsheet column pastes cleanly), upload a CSV whose first column holds the keywords, or Import from Search Console to load a property's top queries by impressions over the last 12 months. The line under the box says how many keywords are ready, and what was merged or removed. Sets need a free account: 10 keywords on a free account, 200 on Pro Solo and 700 on Pro Agency.
How to read the charts
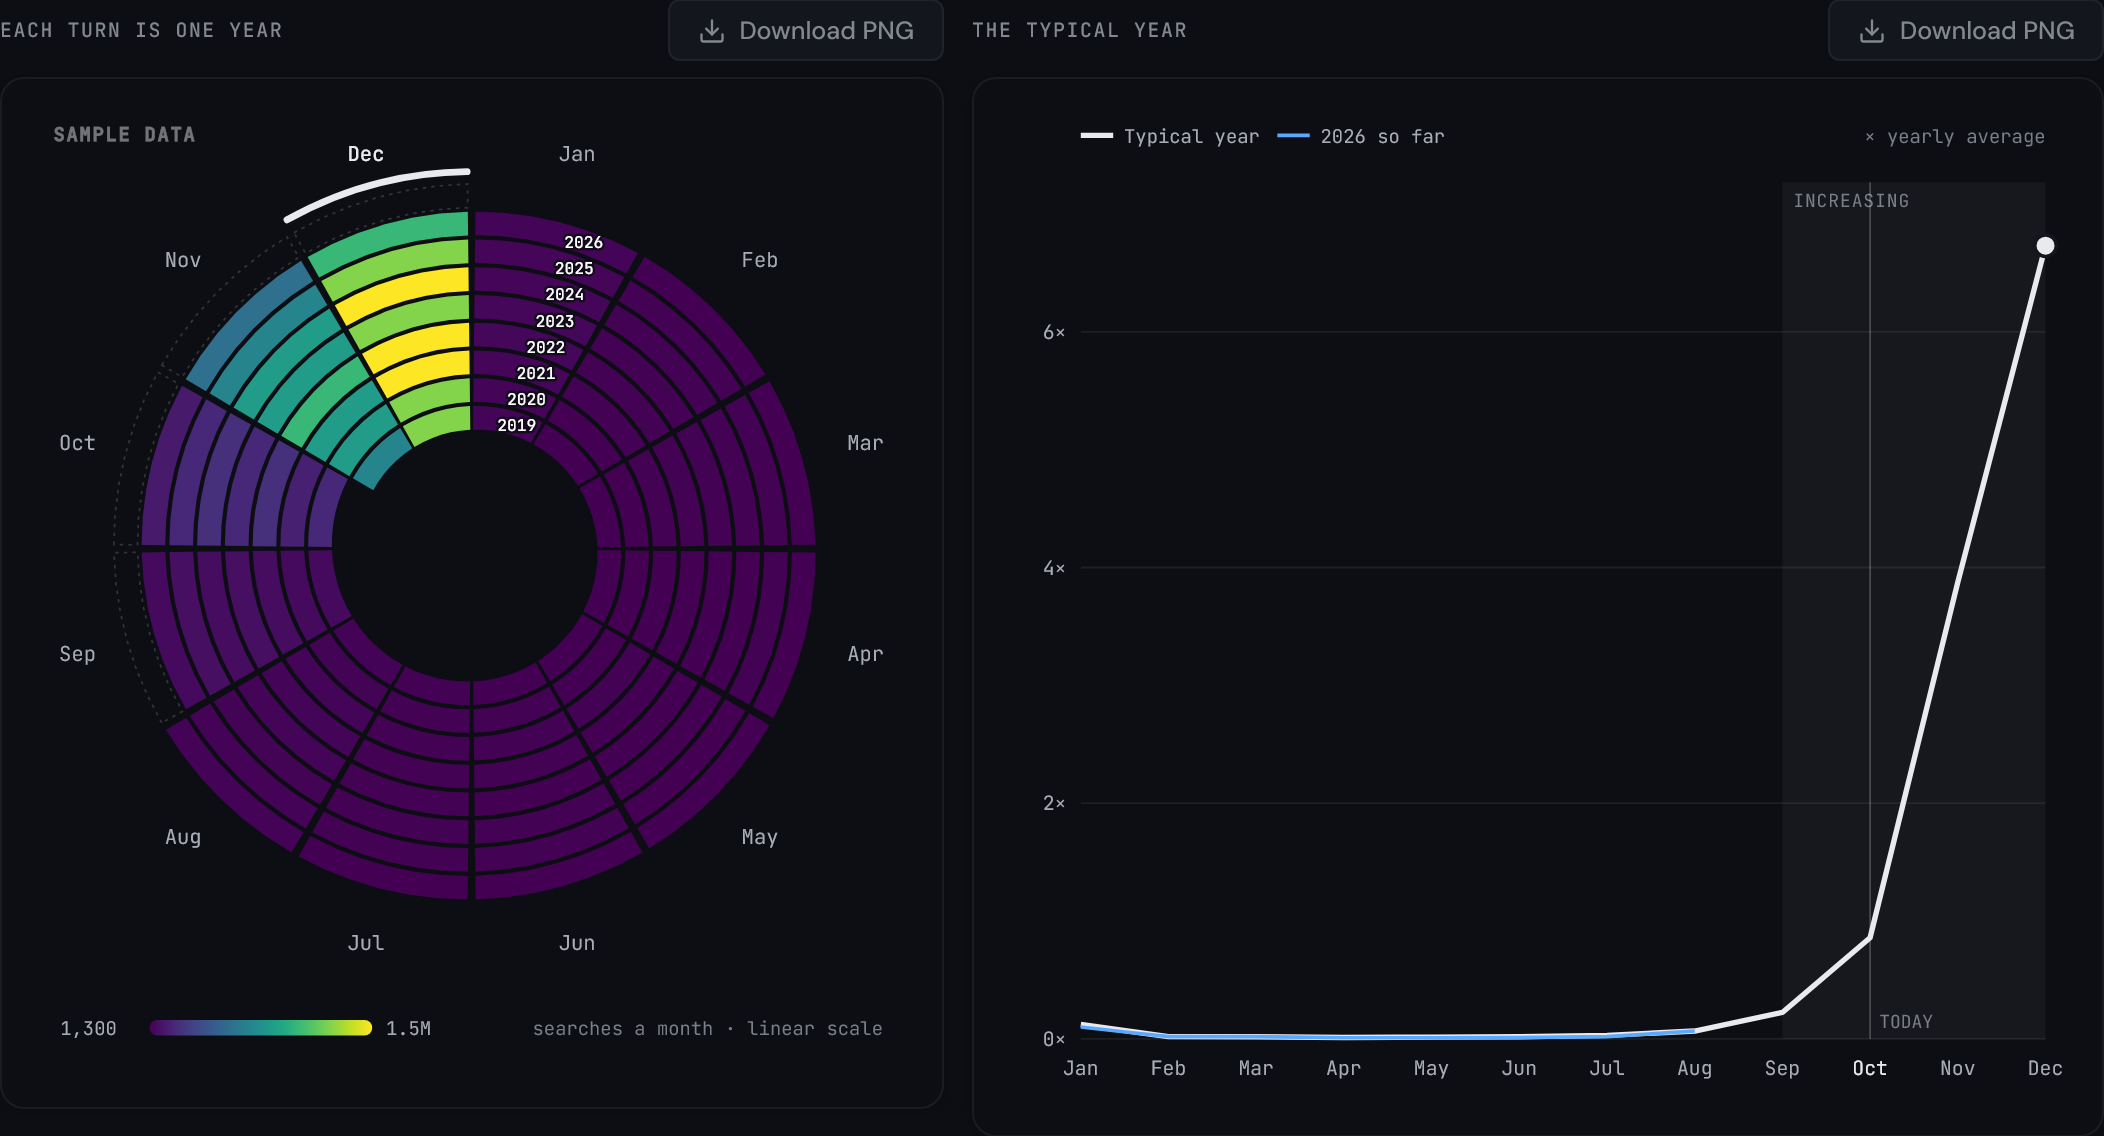
The spiral
One unbroken band winds outward, one full turn per year, starting at the top in January. Each cell is a month, coloured by its search volume against the legend under the chart, which shows the real lowest and highest values and the scale mode in use. Year labels sit just past each January. Months not yet published are drawn as dashed outlines. The white arc outside the spiral marks the peak month. Hover a cell for the exact figure, or focus the chart and use the arrow keys.
The typical year
The bold line is the typical year: each month against the yearly average. The blue line is this year so far, on the same scale. The dashed line at 1× is the average month: anything above it is in season. The shaded band is the increase, from the month it starts to the peak, and the vertical line is today.
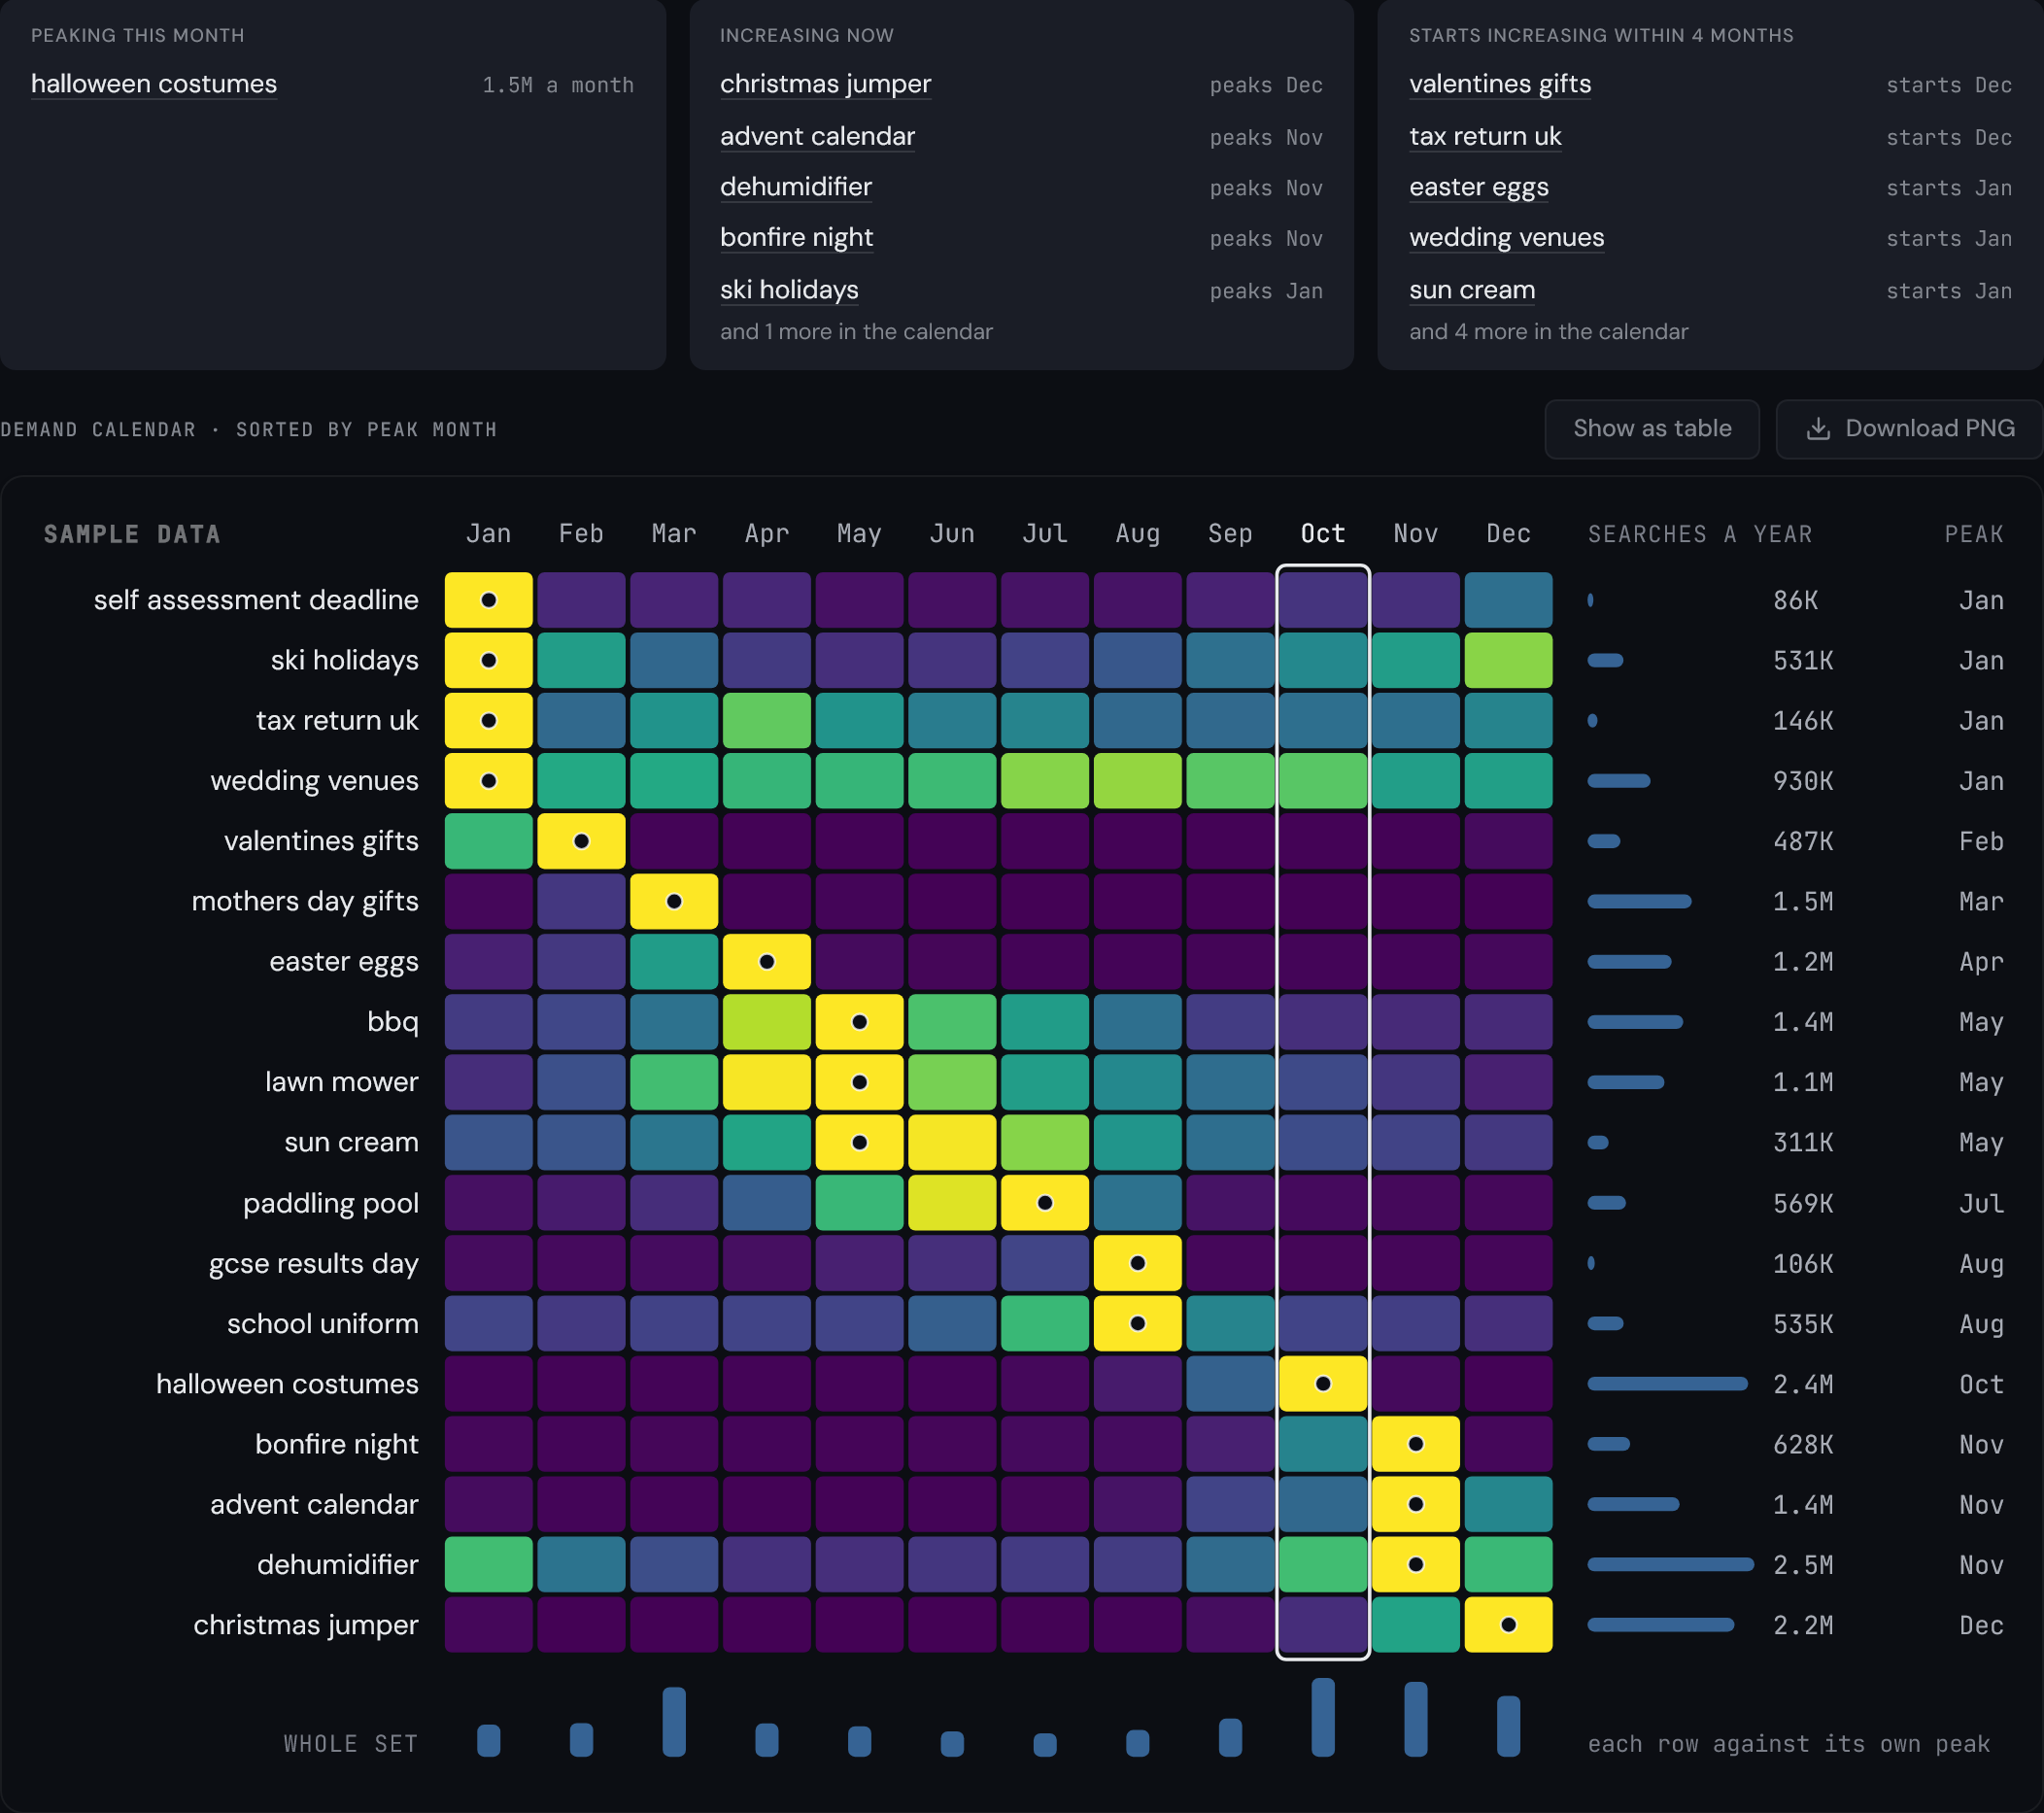
The demand calendar
Each row is a keyword and each column a month. Rows are sorted by peak month, with keywords that have no strong season at the bottom. Each row is coloured against its own peak, so a small keyword's season is as visible as a large one's; the bar on the right shows each keyword's searches in a typical year, so you can still see which keywords are big. The bars along the bottom add up the whole set by month. A dot marks each keyword's peak, and the current month is outlined. Choose Show as table for the same figures as a table, or select a row to open that keyword on its own.
Style options
Colour scale (Viridis, Warm or Cool) and scale mode apply to the spiral, as on the Seasonal Spiral. Linear is the default and maps volume directly to colour. Logarithmic spreads out the quieter months so low-volume detail shows. Reduce outliers clips the top and bottom 2% so one extreme month does not wash out the rest. The calendar always uses a linear scale against each keyword's own peak.
Definitions
These are the terms the tool uses, and exactly what each means.
- Monthly volume. Google Ads' estimate of monthly searches for the keyword in the chosen country. Google rounds these figures into bands, and may combine close variants of a phrase into one figure.
- Seasonal index. A month's volume divided by the average month of the same calendar year. An index of 2 means twice that year's average. Dividing by each year's own average removes growth or decline and leaves the seasonal shape.
- Typical year. For each calendar month, the middle (median) seasonal index across all complete years.
- In season. Months where the typical year is above 1, the dashed line on the chart.
- Peak month. The highest month of the typical year. When fewer than 40% of the past years peaked in that month, the tool says Usually peaks around instead, because the peak moves from year to year.
- Increase starts. The first month demand is a quarter of the way up from its low point to the peak, measured on a log scale, so short, sharp seasons are caught early. It is never later than the month the season itself begins, and never more than six months before the peak. When demand jumps in the peak month itself, the tool says Rises sharply in that month instead.
- Consistency. How many of the complete years peaked in the peak month, shown as "peaked in December in 7 of 7 years".
- Second peak. A separate in-season run with its own high point, at least 1.15× the average, such as a January and an April peak for tax returns.
- Typical volume. For each calendar month, the median search volume across the three most recent complete years. Used for "about N searches" figures.
- Trend. The total searches of the latest complete year against the year before.
- No strong season. The peak month's index is below 1.35, so demand is steady through the year. Between 1.2 and 1.35, a keyword that peaked in the same month in most years counts as a mild season.
- Data to. The newest month of data available. Each month's figures arrive some weeks after it ends, so the latest month shown is behind today.
A keyword can also show one of three states instead of the charts:
- No search volume recorded. Google has no monthly volume for it in that country.
- Limited history. Under two complete years of data, so there is no typical year yet. The spiral still shows the months there are.
- Too little volume to show a season. So few searches that the monthly figures barely change.
A keyword that only started being searched recently (a new product or term) starts its spiral at the first month with searches; the empty months before then are not an error.
Methodology
Monthly search volume comes from a third-party SEO data provider, with history from late 2018 for most keywords. Where a keyword's history is short, the tool adds up to four years of Google Ads monthly volume to fill the earlier months; the main source wins wherever both have a month. Each keyword's data is cached until the next month's data is due, so a keyword set is assembled from already-scanned keywords and only the rest are looked up.
Every figure on the page is computed in your browser from the monthly series, with the same code the Monday email uses. The rules were checked against a sample of nearly 500 keywords across the United Kingdom, the United States and Germany.
The figures describe past patterns. They are not a forecast: a season can shift, and a new product or news event can change demand in a way no history shows.
Privacy and data flow
The keywords you scan and the country are sent to the data provider to look up their volume. Search Seasonality does not send your keywords to any AI provider. Looking up a single keyword needs no account. On a free account, Search Console import signs you in to Google in your browser with read-only access, and your queries go straight from Google to the page. See the privacy policy for the full detail.
Free and Pro
- No account: any single keyword, both charts and the four figures, and PNG export.
- Free account: keyword sets of up to 10 keywords, by paste, CSV upload or Search Console import.
- Pro: sets of up to 200 keywords (700 on Agency), saved sets (filed under client workspaces on Agency), CSV export, and a line in your Monday email when a saved keyword starts increasing and when it peaks. The Track button adds a keyword to your weekly ranking tracking, shown on your dashboard.
Frequently asked questions
Why is the latest month behind today?
Google publishes each month's search volume some weeks after the month ends. The page shows the newest month available as "data to".
Does a scan of a keyword someone already looked up count?
The rate limit (10 scans a minute) counts every scan, and keyword-set scans count towards your daily set-scan limit even when every keyword is already cached. Cached keywords do come back faster.
Where are the rankings?
Search Seasonality is about demand, not rankings. To follow who ranks for a keyword, use the Track button (Pro): the keyword is checked every week and the results appear on your dashboard and in the Monday email.
Why do two keywords show exactly the same figures?
Google often combines close variants (such as singular and plural) into one figure. In a keyword set they are merged into one row, and the other phrasings are listed under the calendar.
Why was a keyword removed from my list?
Google limits a keyword to 80 characters and 10 words, and does not accept some symbols, such as ! @ % or quotation marks. Keywords that break those rules are listed as removed, with the reason.
Can I hide branded queries from a Search Console import?
Yes. Tick Hide branded queries before loading, and queries containing your property's name (taken from its domain) are left out. Nothing is left out unless you tick it.